
The U.S. associates two statues with the cornerstones of its republic. The two figures are the Statue of Liberty, her torch lighting the way for immigrants, and Lady Justice, blindfolded to avoid bias from the eyes in the court.
The reality is that people, not statues, make decisions about immigration. And in the courts and their deliberations, they bring along preconceptions about race and religion. A new analysis of naturalization data reveals the current impact of those biases. When it comes to who reaches the goal line for U.S. citizenship, women are favored over men, white people are favored over people of color, and non-Muslims are favored over Muslims.
“It’s a really important example of the inequality embedded in the immigration system,” says David Hernández, an associate professor of Latina/o studies at Mount Holyoke College, who was not involved in the new paper. Naturalization may seem like a relatively innocuous and positive immigration process, he says, but it has a long history of bias. “One of the oldest statutes in the United States is the 1790 Naturalization Act that created a white racial prerequisite,” and some form of official discrimination in naturalization persisted well into the mid-20th century, Hernández adds.
The study, published on February 22 in the Proceedings of the National Academy of Sciences USA, relied on information obtained from U.S. Citizenship and Immigration Services (USCIS). The data were not publicly available and could be acquired only through a Freedom of Information Act request, which was filed by the study’s first author, Emily Ryo, a professor of law and sociology at the University of Southern California Gould School of Law. Ryo, whose work focuses in part on immigration and criminal justice, filed two such requests, in fact, followed by litigation that ultimately led to a release of naturalization data covering October 2014 through March 2018.
Using information from 2,687,101 applications that were decided during this time, Ryo and a colleague looked at rates of approvals and denials by race or ethnicity, religion (defined as whether an applicant was from a Muslim-majority country or not) and gender. They adjusted their analyses for a few factors that might affect outcomes, including socioeconomic and marital status, age and whether or not applicants had children.
The findings showed that, overall, about 92 percent of people who applied were approved. Among all applicants, about 18 percent were white, about 31 percent were Asian, and about 13 percent were Black. About 38 percent were listed as Hispanic. More than half were women. The authors considered religion separately, with a focus on Muslims because of ongoing Islamophobia in the U.S., and found that about 12 percent were originally from a Muslim-majority country.
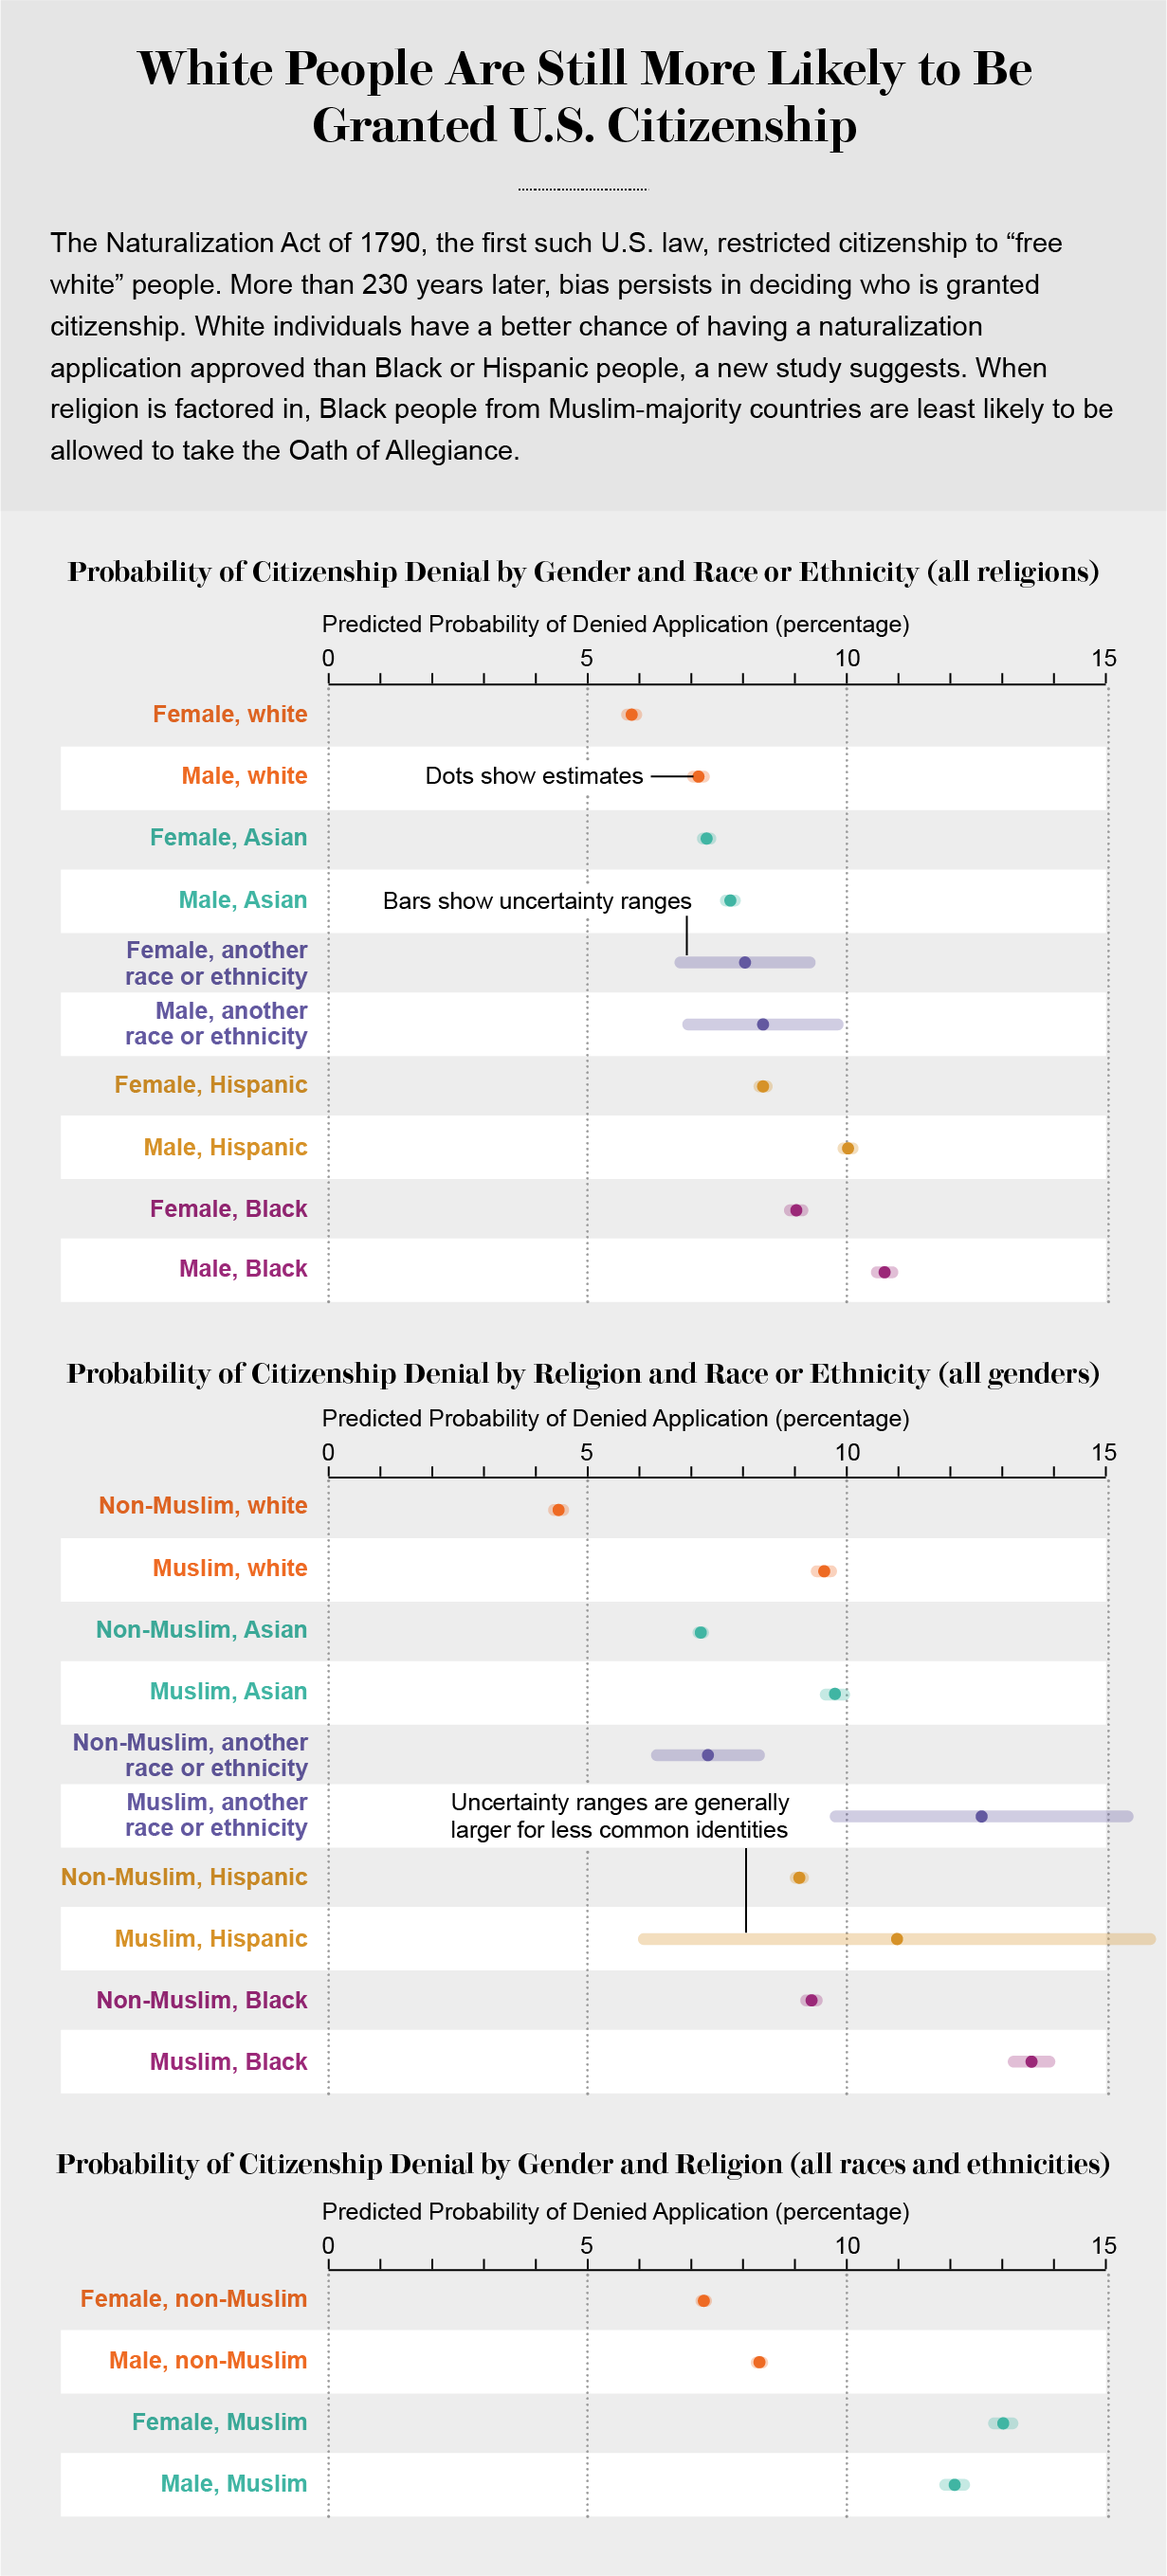
The addition of a Muslim-majority country of origin to any race or gender was associated with lower approval probabilities in all cases. White applicants from non-Muslim-majority countries had the highest predicted probability of acceptance, at 95.56 percent, compared with 90.43 percent of white applicants from Muslim-majority countries. The probability for Black non-Muslim applicants was 90.68 percent, compared with about 86.43 percent for Black Muslim applicants, who had the lowest chances.
Being Black was also linked to lower chances of approval overall. For Black women, the probability of approval was 90.98 percent, compared with 94.15 percent for white women and 92.7 percent for Asian women. For Black men, the likelihood of approval was 89.27 percent, in contrast to 92.86 percent for white men. Being Hispanic or male was associated with reduced chances as well.
Although the gaps in admission rates may not seem huge—the biggest was 9.13 percentage points between white non-Muslim applicants and Black Muslim ones—their translation into real numbers and real people is substantial, Ryo says. That difference adds up to more than 3,600 Black people from Muslim-majority countries who would otherwise have been approved. For Black men, the numbers are even higher, with almost 8,000 additional people who could have been approved during the study period if their approvals tracked with those for white women.
Hernández points out that most applicants were married and most had children. “A single rejection has an enormous impact on the family unit,” he says. “Those rejections are affecting whole families, who may be losing a breadwinner. I found the numbers very significant.” To seek citizenship, an applicant must file a 20-page-long N-400 form, pay a fee of $725 and fulfill other requirements, such as proving residency, U.S. civics knowledge, English-language ability and submitting to a criminal background check.
What is especially striking, Ryo says, is that federal law mandates uniformity in how applicants are treated in the naturalization process, regardless of demographic factors, such as race and religion. If uniformity were truly in effect, “we should not expect to see even small differences,” she says.
One factor feeding into the disparities likely is the “good moral character” requirement for naturalization approval, which allows for subjectivity among adjudicators in USCIS state field offices, Ryo says. Other potential influences are structural, such as the fact that law enforcement disproportionately targets Black people, raising their odds of a criminal history that could feed into the “good moral character” determination, she says. With adjudicators sitting in field offices in different states, there is also an opportunity for local cultural factors to introduce bias.
How bias translates among field offices across the country is the subject of Ryo’s next report, which will be published in the Minnesota Law Review. She found that rates of approval vary by state, from as low as 79 percent up to 97 percent. Approval rates are significantly lower in field offices sited in white-majority and Republican counties and counties with higher unemployment rates. The numbers may vary, but they add to a picture in which U.S. naturalization fails to live up to the promise of Lady Liberty’s torch or the objectivity symbolized by Lady Justice’s blindfold.