
By telling the story of COVID-19 in real time, data visualization has taken on new importance in our daily lives. Early in the pandemic, we watched circles multiply and swell on a map as the virus spread around the globe. We saw lines on time-series charts turn nearly vertical during surges in cases. These numbers and their pictorial signifiers have been critical for informing our behaviors over the past two years, but they hardly capture the full significance of the crisis and its many snowball effects. Much of the fallout—from personal and collective traumas to profound economic disruption—can also be measured to help us tell a fuller story of how COVID has changed the world. The visualizations that follow focus on the emergence of potential trends, sudden pivots and troubling setbacks; we also explore the consequences of some dramatic, if temporary, blips. Because no story can be captured by data alone, context and caveats are provided throughout.
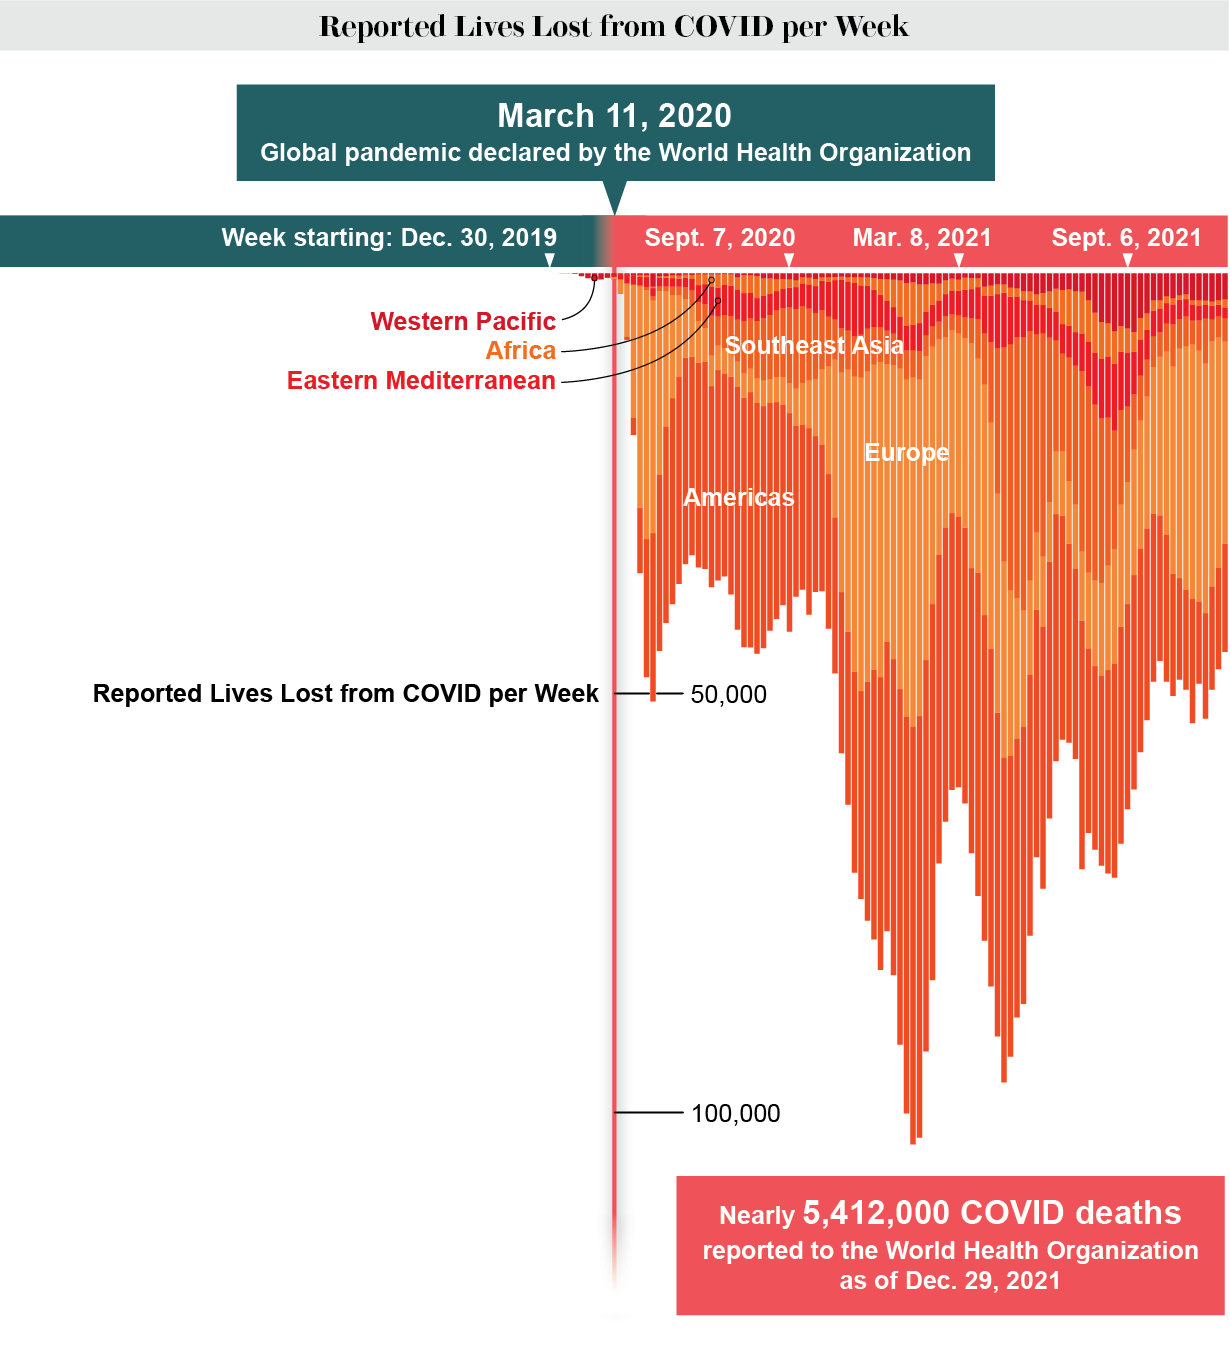
LIVES LOST
The most obvious change is perhaps the most staggering: the pandemic has caused an enormous loss of life. The numbers portrayed here only reflect COVID-related deaths that were reported to the WHO. As a result, they are very likely undercounted, particularly in regions where data-collection methods are less reliable or reporting mechanisms are less robust.
HEALTH
Globally, COVID has changed people’s health in ways that go far beyond the acute impact of the disease. Efforts to limit the virus’s spread, as well as the death toll itself, have generated widespread fear, isolation and economic hardship, the effects of which will be felt for generations.
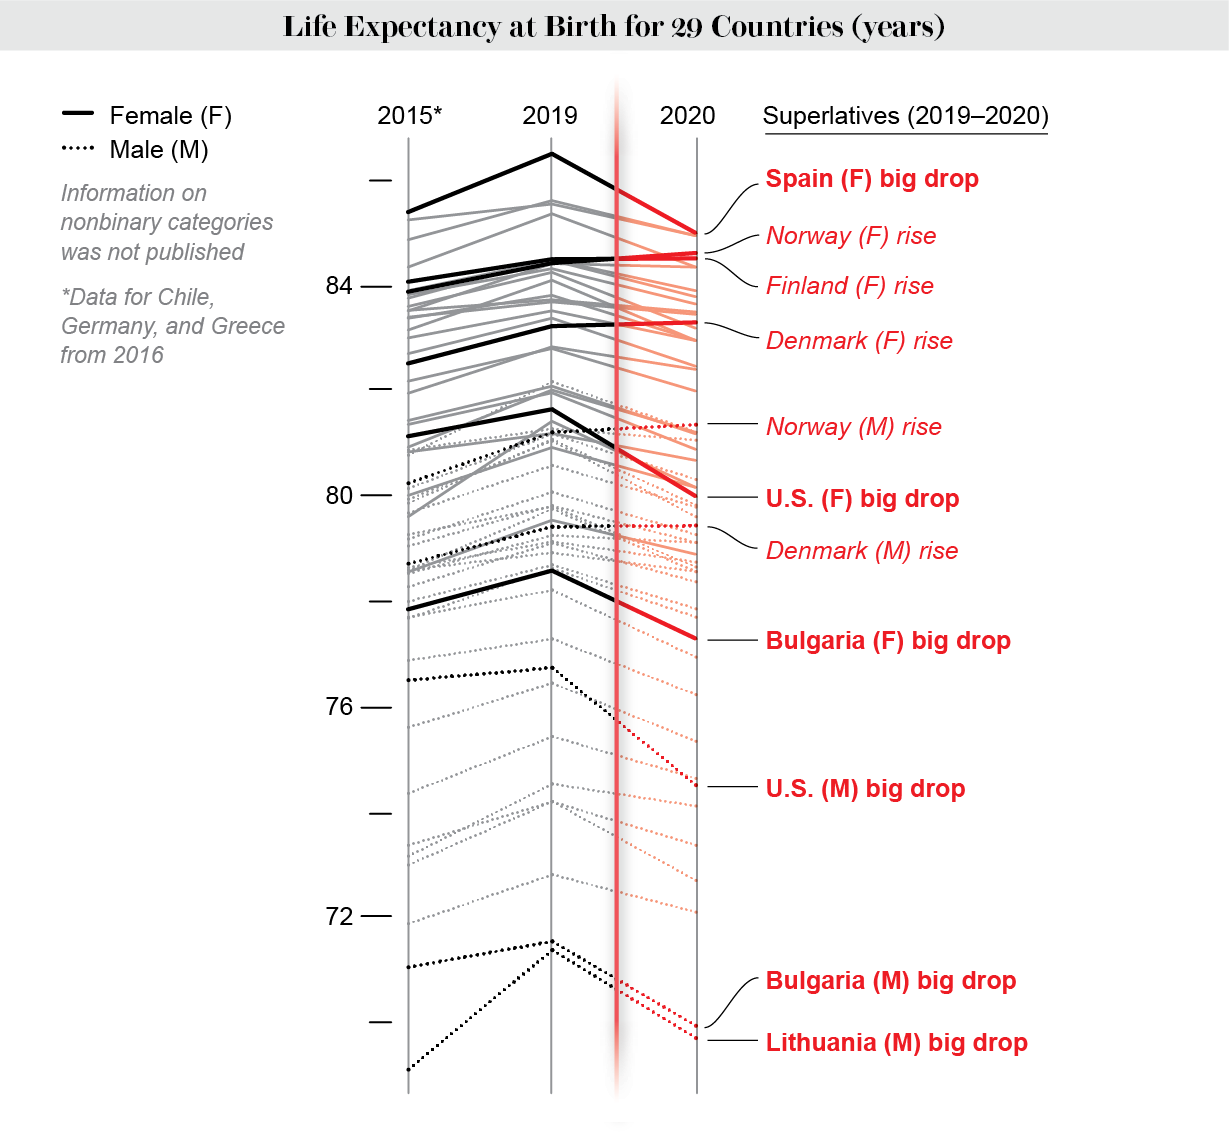
Life Expectancy
A useful measure of population health and longevity, the indicator known as “life expectancy at birth” has been on the rise in most places for the past century. In a recent study of 29 countries, COVID single-handedly reversed that trend in 27 of them. Life expectancy is typically measured separately for males and females; overall, the pandemic’s toll was greater among males.
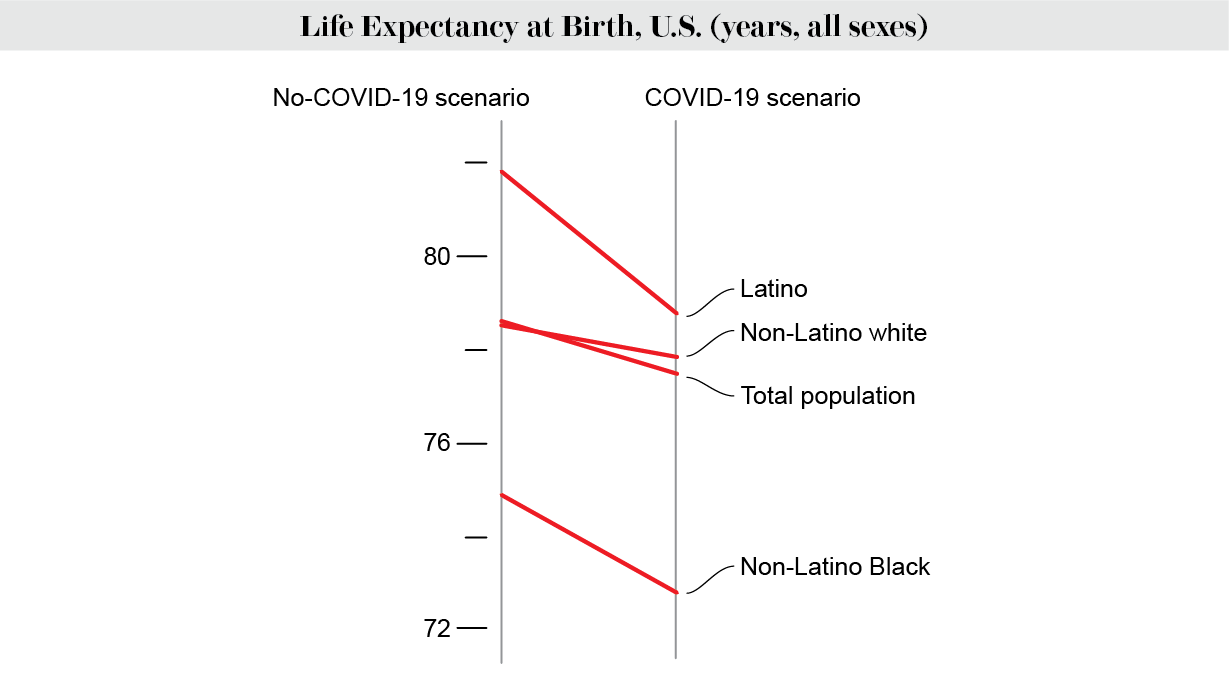
Overall life expectancy in the U.S. has plummeted, but some populations suffered more than others. The pandemic’s disproportionate impact on communities of color underscores the serious health effects of racial and ethnic inequality.
Food Insecurity
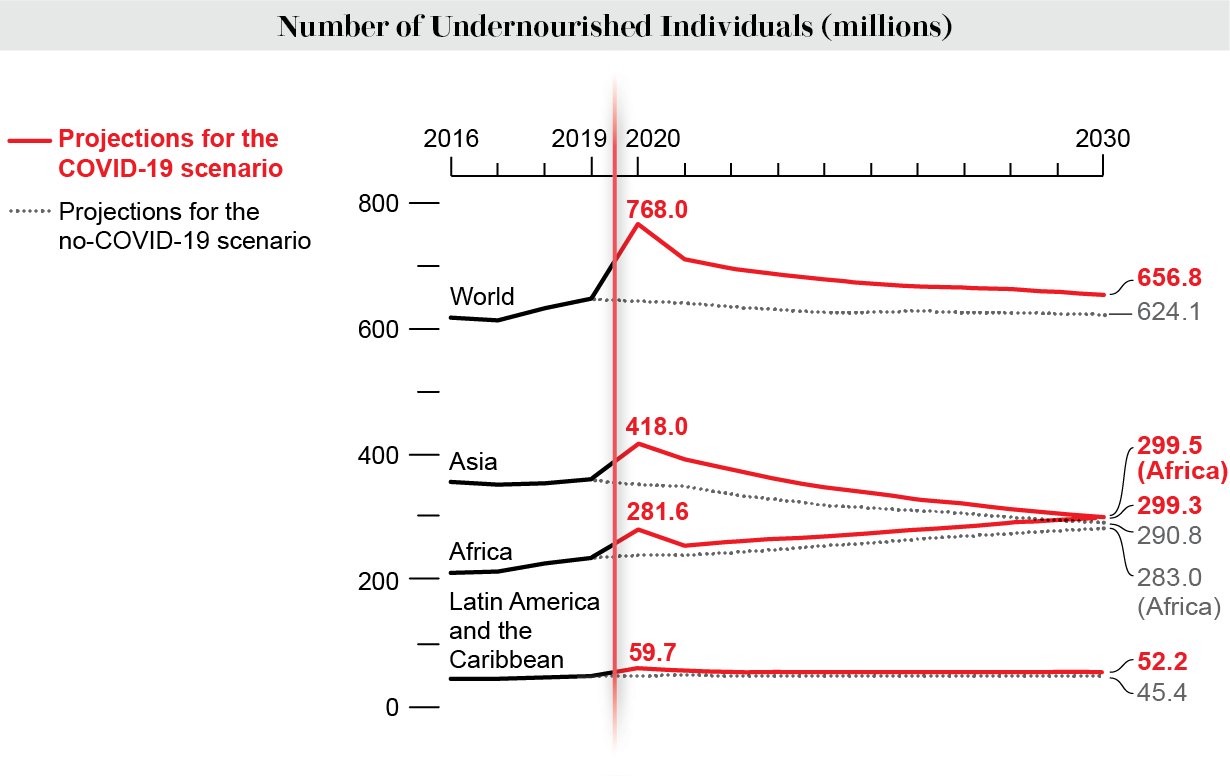
Factors such as climate change and pervasive inequality were already contributing to high rates of food insecurity. A recent report found that the pandemic caused an immediate spike in undernourishment both globally and regionally in 2020, primarily related to people losing their jobs or experiencing a reduction in work hours amid lockdowns. It also compared projected numbers of undernourished people over the next decade with what those values would be without COVID. The data suggest that these seemingly acute disruptions will have a long tail: COVID scenario projections largely exceed no-COVID ones as far out as 2030.
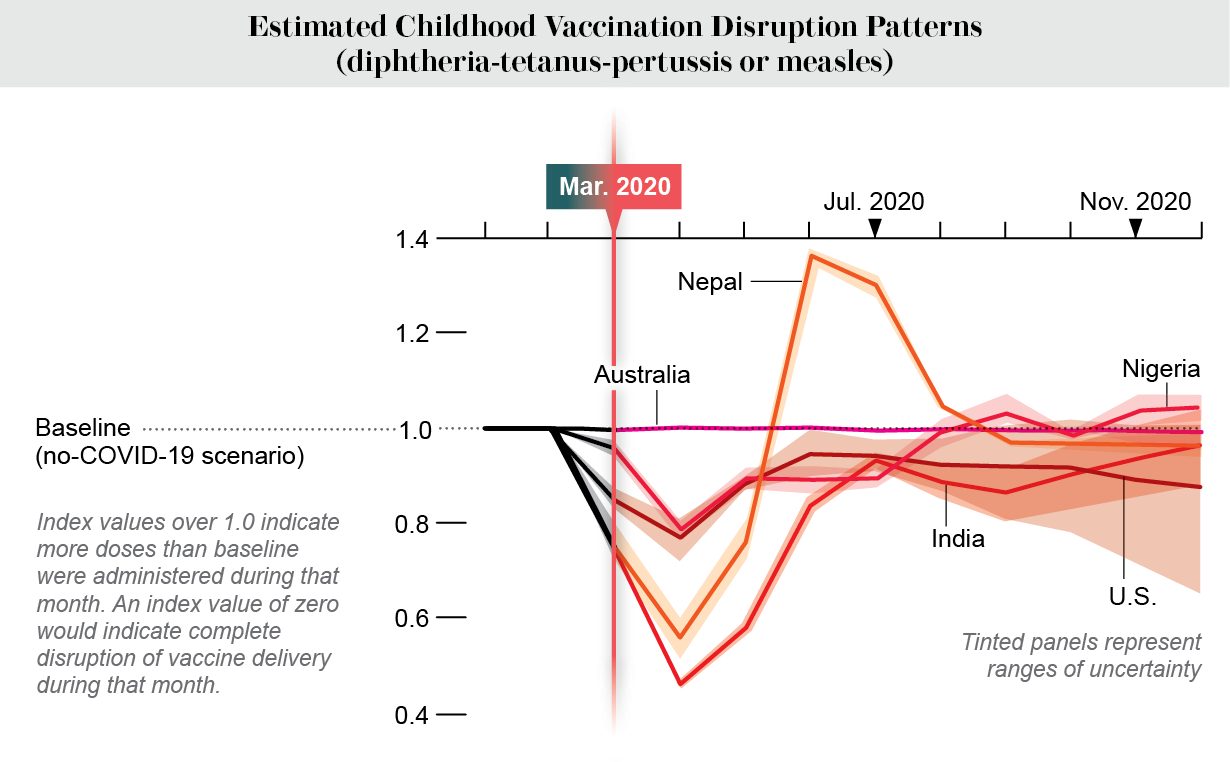
Childhood Vaccinations
Despite ubiquitous talk of vaccines, rates of immunization against diseases other than COVID have recently fallen. A study tracking children due for their third dose of the diphtheria-tetanus-pertussis vaccine and their first dose of the measles vaccine estimated that between eight million and nine million more doses of each vaccine were missed globally compared with what was expected, with coverage dipping lowest in April 2020. Numbers have improved since then, but in some countries, coverage remains lower than it would be without COVID.
Birth Rates
Globally, COVID’s impact on birth rates has been mixed. In many high-income nations, people had fewer babies than expected in 2020, perhaps because of high levels of stress and financial uncertainty. But in low- and middle-income countries, pandemic restrictions disrupted access to contraceptives for an estimated 12 million women, resulting in nearly 1.4 million unintended pregnancies.
Loss of Caregivers
In October 2021 the CDC reported that one in four COVID deaths in the U.S. deprived a child of a primary or secondary caregiver. From April 2020 to June 2021, this amounted to 140,000 children affected, a disproportionate number of whom were kids of color.
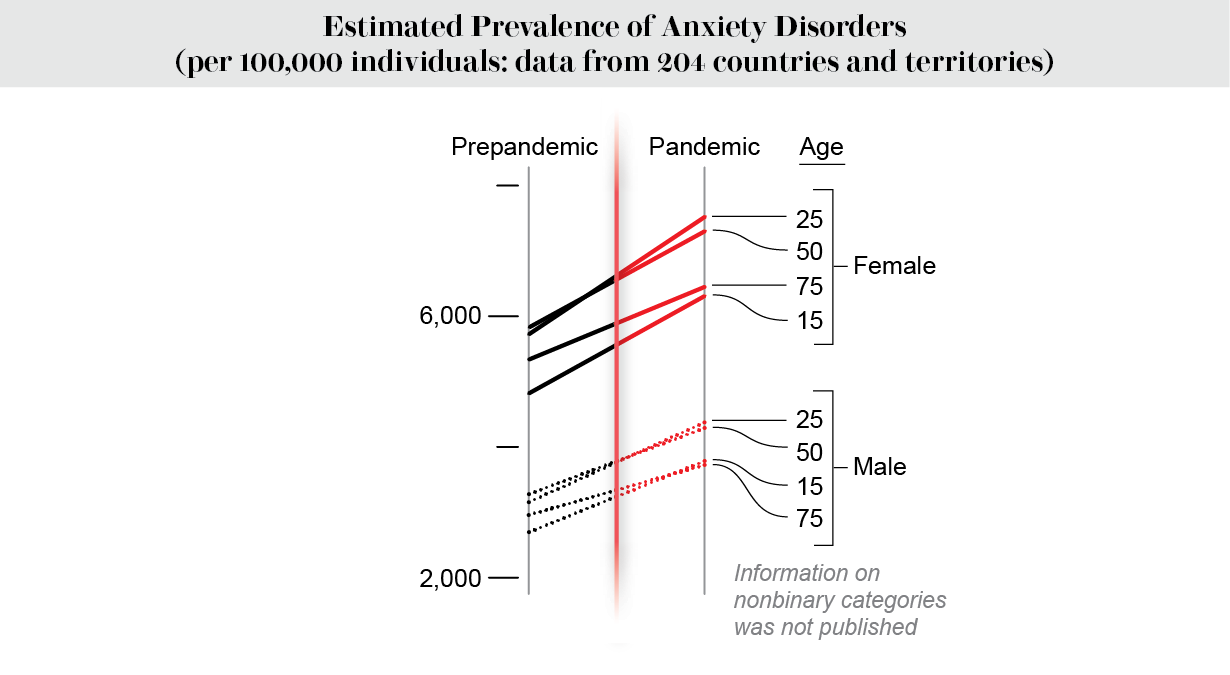
Mental Health
The global prevalence of depressive disorders grew by nearly 28 percent in 2020, and anxiety disorders rose by almost 26 percent, according to a study in the Lancet. This explosion of cases was linked to pandemic-related factors such as high infection rates and decreased mobility during lockdowns.
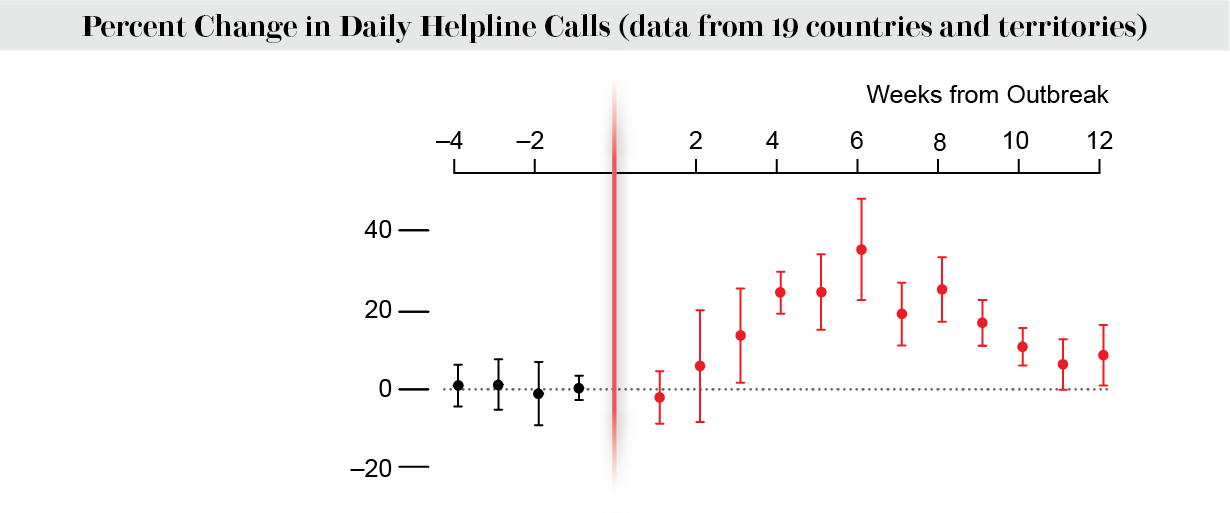
One study in Nature evaluated mental health effects by tracking calls to helplines in 19 countries. Call volume was up 35 percent compared with prepandemic levels, with more callers than usual expressing feelings of fear and loneliness.
Changes in mental health disorders do not capture the full picture of loss, stress and isolation.
“The mental health consequences of COVID could lead to long-term losses in well-being, diminished economic productivity and increasing health-care costs. Unfortunately, the existing U.S. mental health system is sorely lacking a public focus: it engages largely with those who are already mentally ill and often only those who are able to pay for treatment.” —Psychiatry residents Sofia Noori and Isobel Rosenthal in Scientific American, June 2020
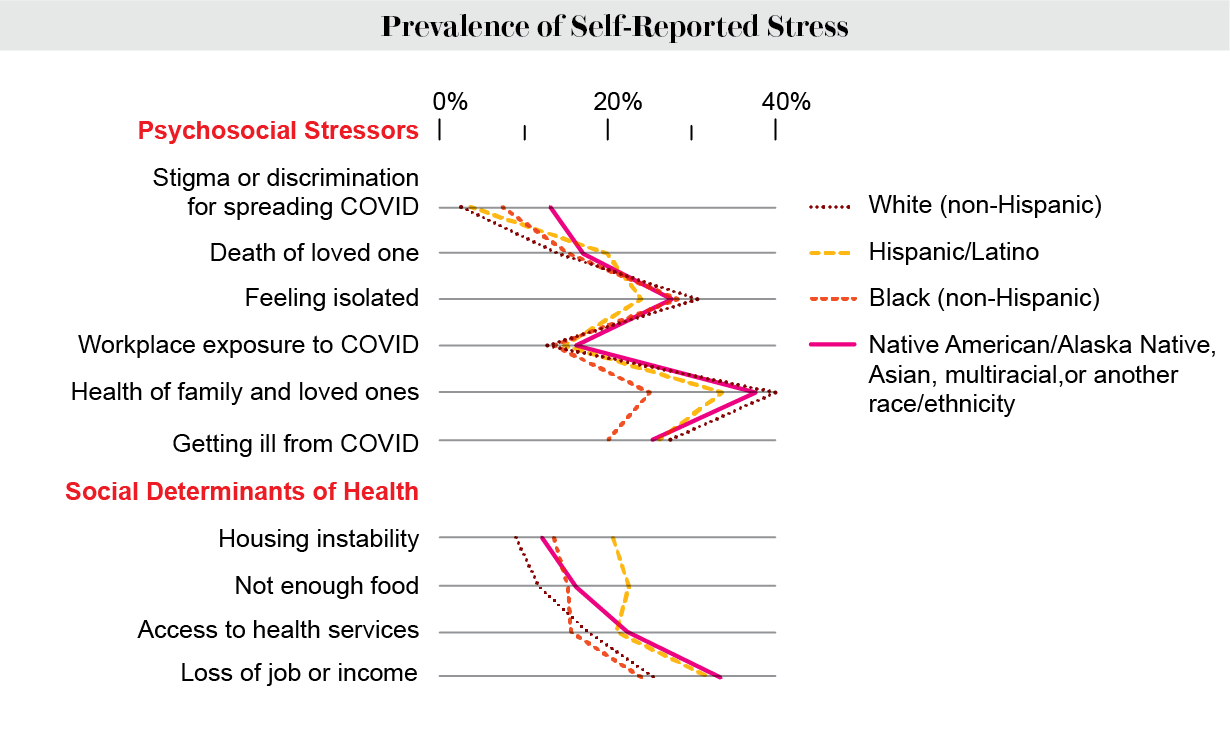
COVID caused new types of stress. A CDC survey conducted in April and May of 2020 evaluated prevalence of depression, suicidal ideation and the initiation of substance abuse, along with specific pandemic-associated stressors and social determinants of health. Rates of these issues varied across racial and ethnic groups. For example, Hispanics reported outsize rates of both housing instability and suicidal ideation. Meanwhile those identifying as Native American/Alaska Native, Asian, multiracial, or another race or ethnicity not listed separately in the survey reported the highest rates of stigma around viral spread, job or income loss and lack of access to health services.
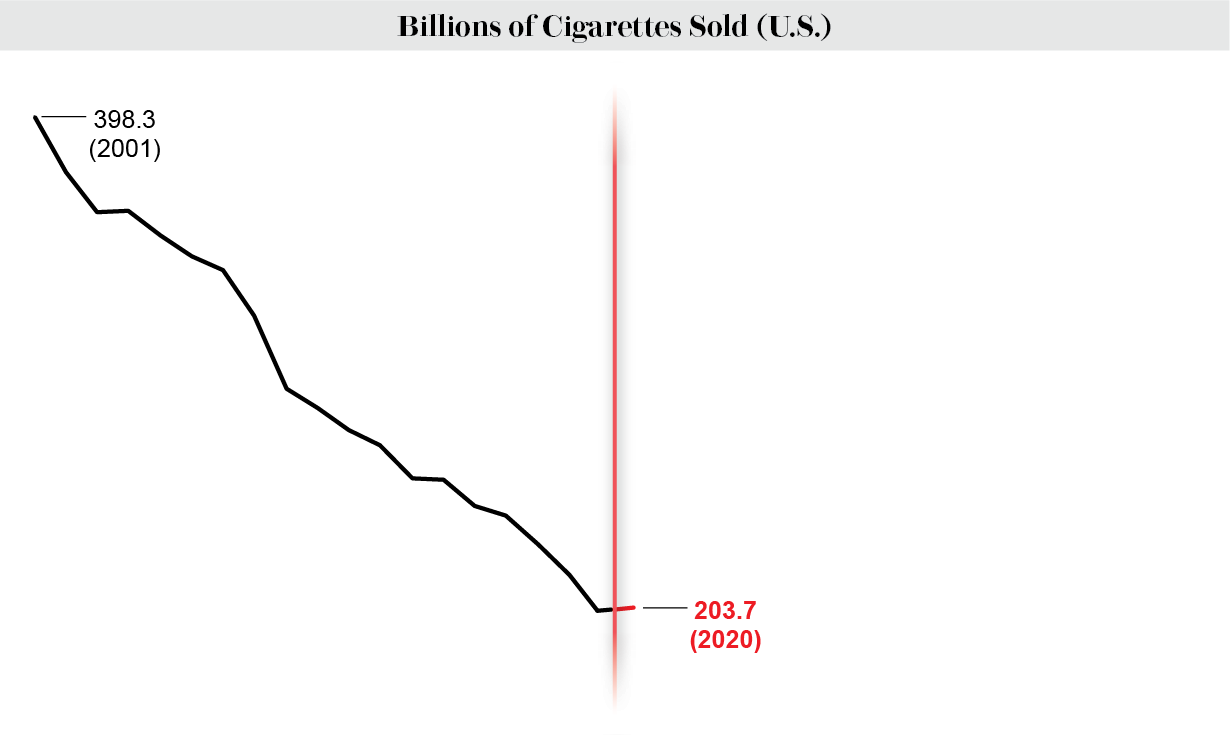
Substance Use
Cigarette Sales: In 2020 cigarette sales in the U.S. increased for the first time in nearly 20 years.
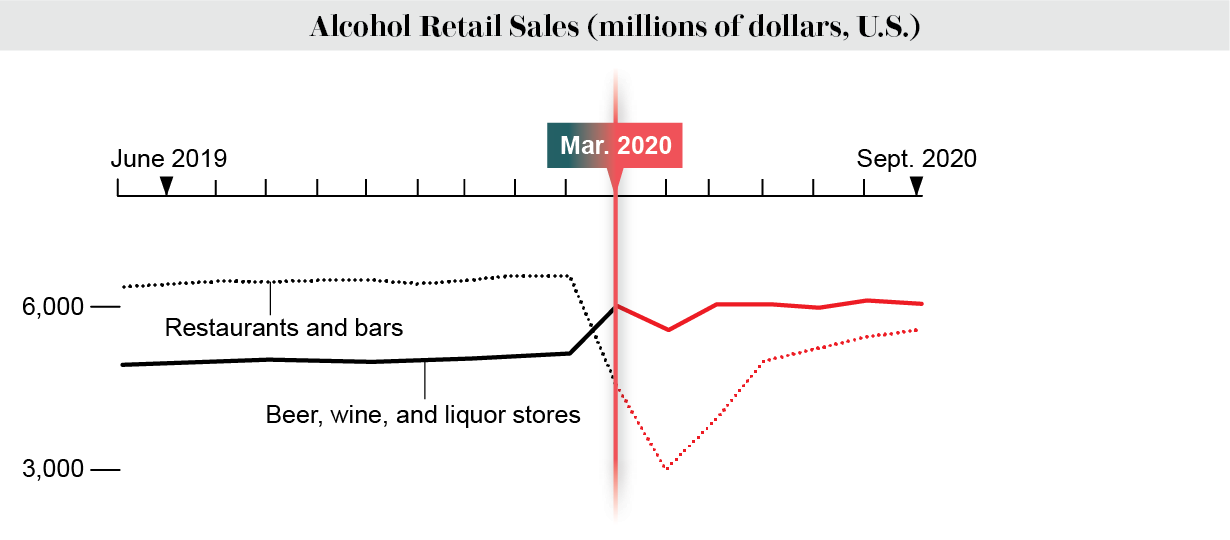
Alcohol Sales: From March to September 2020, retail sales of alcoholic beverages in the U.S. jumped by 20.4 percent compared with the same period in 2019. This change was accompanied by a decrease in sales at restaurants and bars, so it is hard to say whether the pandemic prompted people to consume more alcohol overall. But drinking at home certainly became more prevalent.
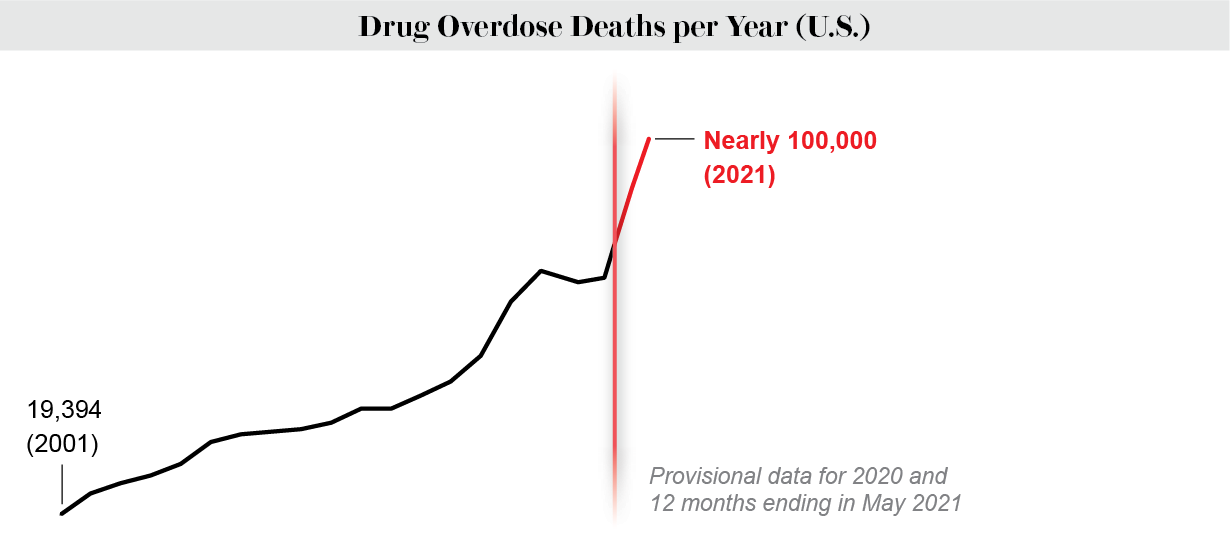
Drug Overdose Deaths: People in the U.S. died from drug overdoses in unprecedented numbers following the onset of the pandemic, according to CDC data. The period from April 2020 to April 2021 represented the first time over 100,000 overdose deaths were reported in a single year. Many of these deaths were attributed to fentanyl, the powerful synthetic opioid that has flooded the illegal drug market following a surge in prescription opioid addiction in recent years.
SCIENTIFIC RESEARCH
Beginning in March 2020, some research projects screeched to a halt, whereas others suddenly ramped up. An urgency to understand COVID—and the underlying public health issues it has revealed—may have prompted a reevaluation of priorities in scientific research.
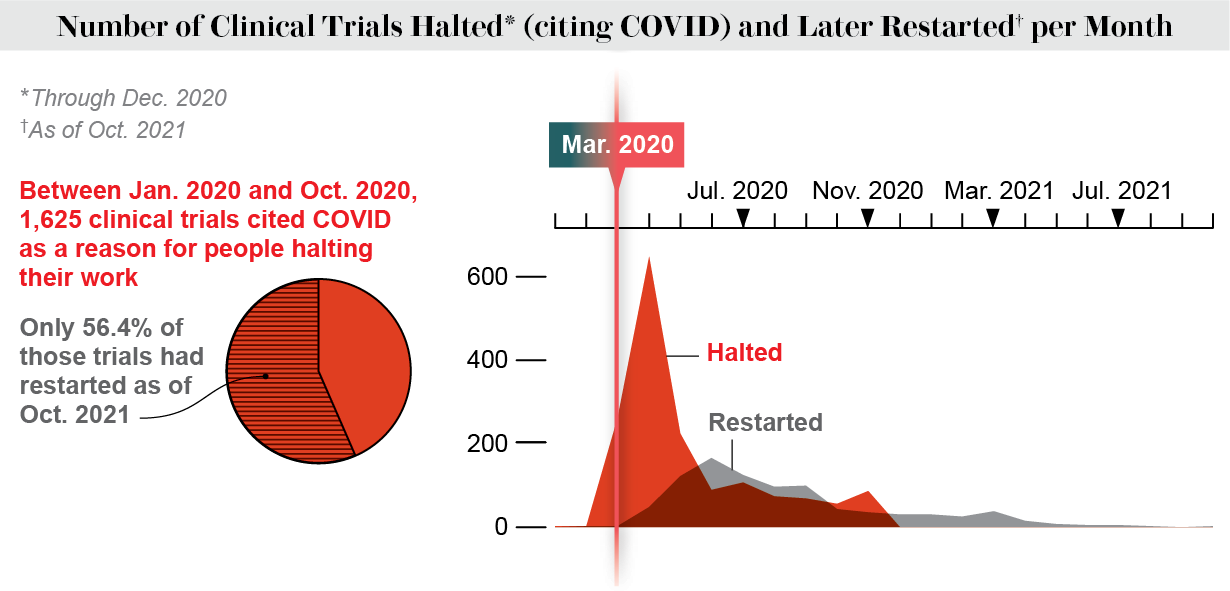
Clinical Trials
During the period of December 2019 through January 2021, 2,043 clinical trials globally were suspended or paused because of COVID-19. Some of those have subsequently restarted, but many have not.
Funding by the National Institutes of Health
Out of a total of 200 broad research areas, certain categories of NIH funding experienced especially large increases from 2019 to 2022 (which is a projected budget). Some seem clearly linked to the pandemic: social determinants of health, for example, are related to COVID’s disproportionate impact on certain populations. Other areas, such as influenza and vector-borne disease, received relatively little investment.
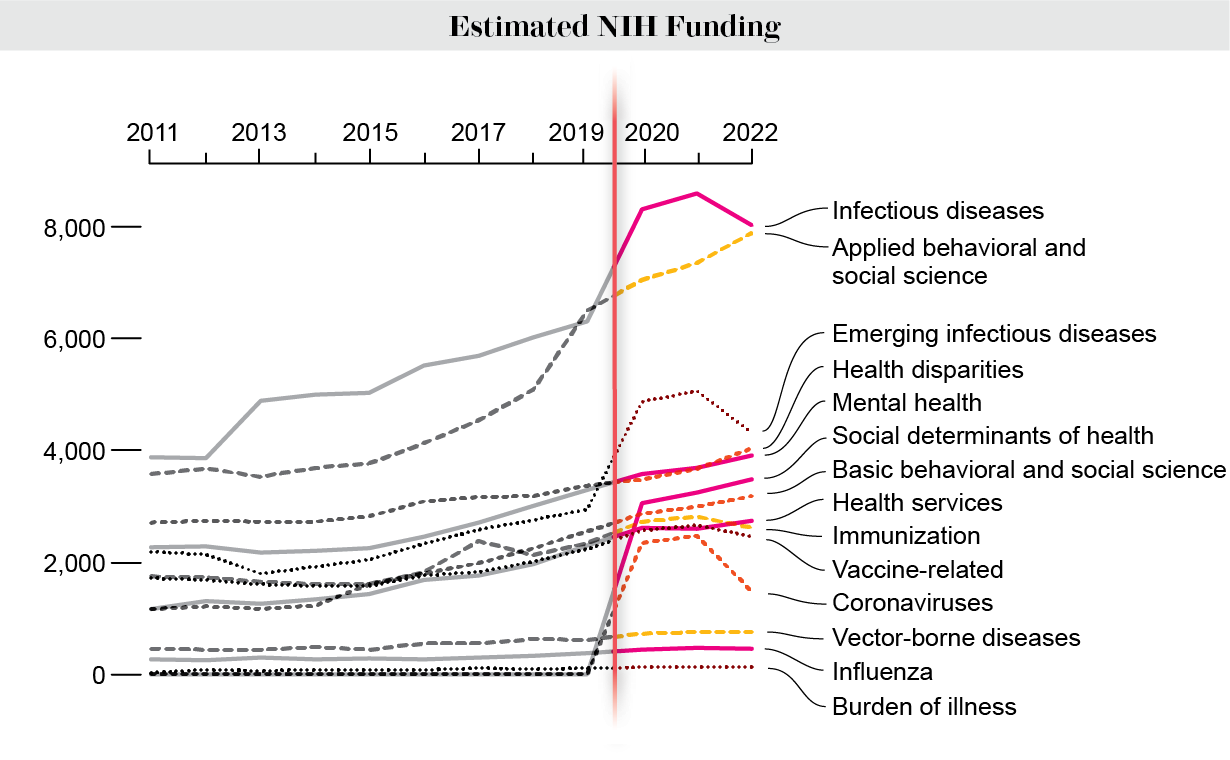
Behavioral science research is on the rise. Reflecting on how misinformation exacerbated COVID’s impacts in the U.S., outgoing NIH director Francis Collins told PBS NewsHour: “I wish we had more insights from behavioral social science research into how this has come to pass and why it could have gotten so completely widespread. I want to call this out as one of my most major concerns as I stepped down from the NIH, of looking at the situation in our nation.” The NIH’s increased investment in the field in 2022 reflects Collins’s concerns.
EMISSIONS
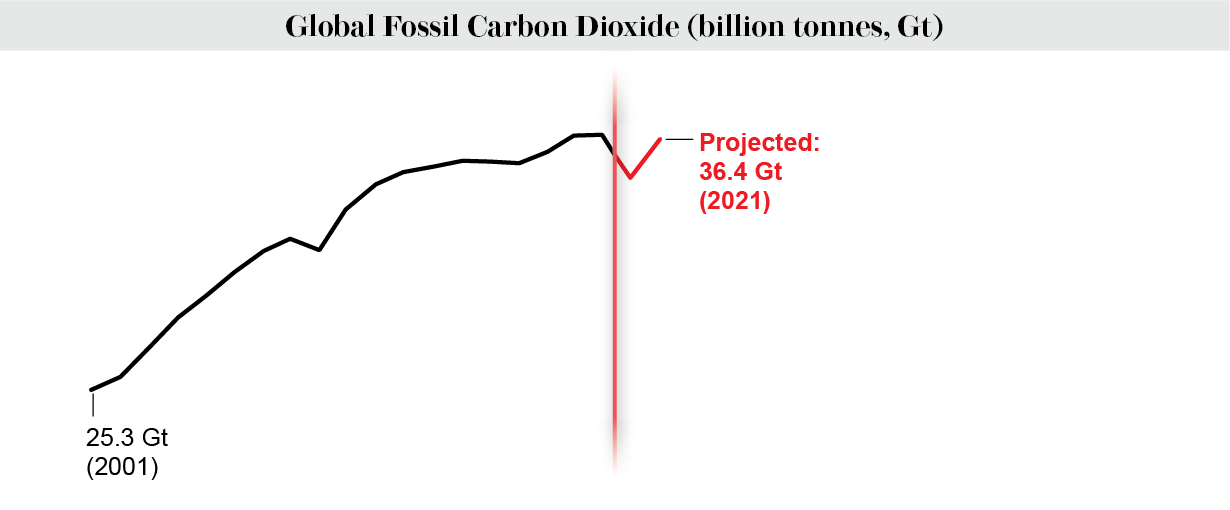
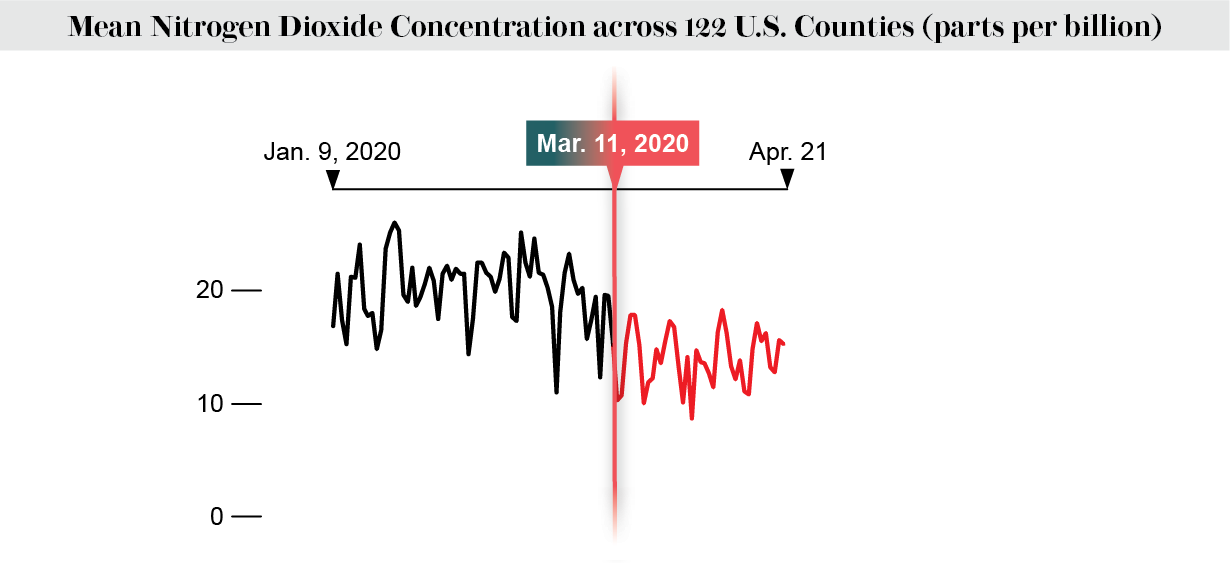
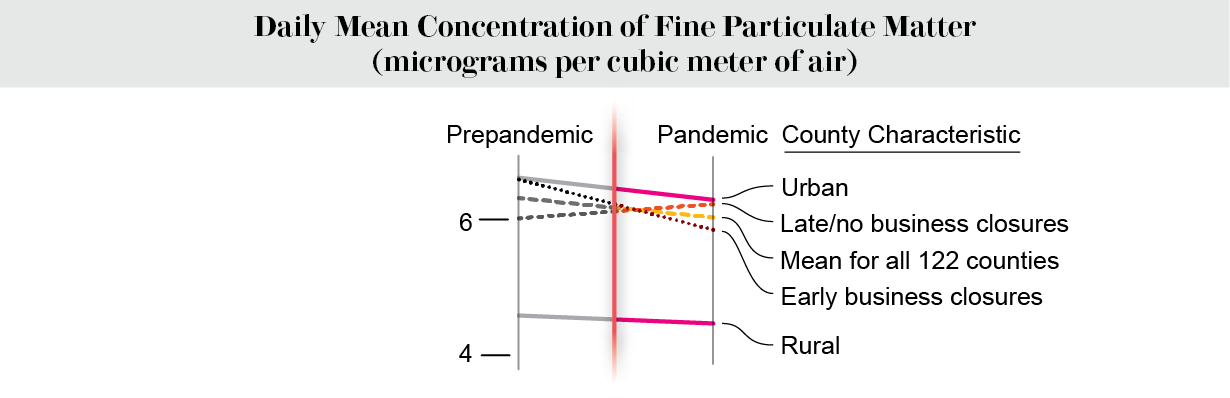
When governments issued lockdowns and other restrictions in response to COVID, transportation and commercial energy consumption dropped suddenly. The result was a striking decrease in air pollution. But studies tracking changes in carbon dioxide, nitrogen dioxide and fine particulates also show a rebound toward prepandemic levels.
CO2: According to CarbonMonitor.org, global emissions of carbon dioxide, the greenhouse gas responsible for the majority of global warming, fell by a considerable 5.4 percent in 2020 but have since rebounded to levels approximating those of 2019.
NO2: Nitrogen dioxide is emitted through the burning of fossil fuels and is associated with human respiratory problems. In the first several weeks of pandemic lockdowns in the U.S., levels of this gas dropped by more than 25 percent relative to the same period in the previous three years.
Fine Particulates: Following lockdowns in the U.S., fine particulate matter (PM2.5) stayed relatively close to prepandemic levels overall. Researchers did find, however, significant decreases in urban areas and those where nonessential businesses closed early.
Reducing emissions is possible— but how we get there matters. The pandemic’s immediate impact on emissions proves that collective behavioral changes can produce swift results. But there is little about the painful conditions of the pandemic that anyone desires to replicate. One exception is the shift to remote work for millions of people who formerly commuted by car. Policies that support telecommuting could help sustain a decrease in emissions.
ECONOMY
COVID’s economic impacts are as varied as they are significant. From a distance, it is easy to identify clear winners and losers: air travel and hospitality industries suffered, for example, whereas video calling and online shopping skyrocketed. But a closer look at the data reveals a more granular picture because different people experienced these changes in varying ways.
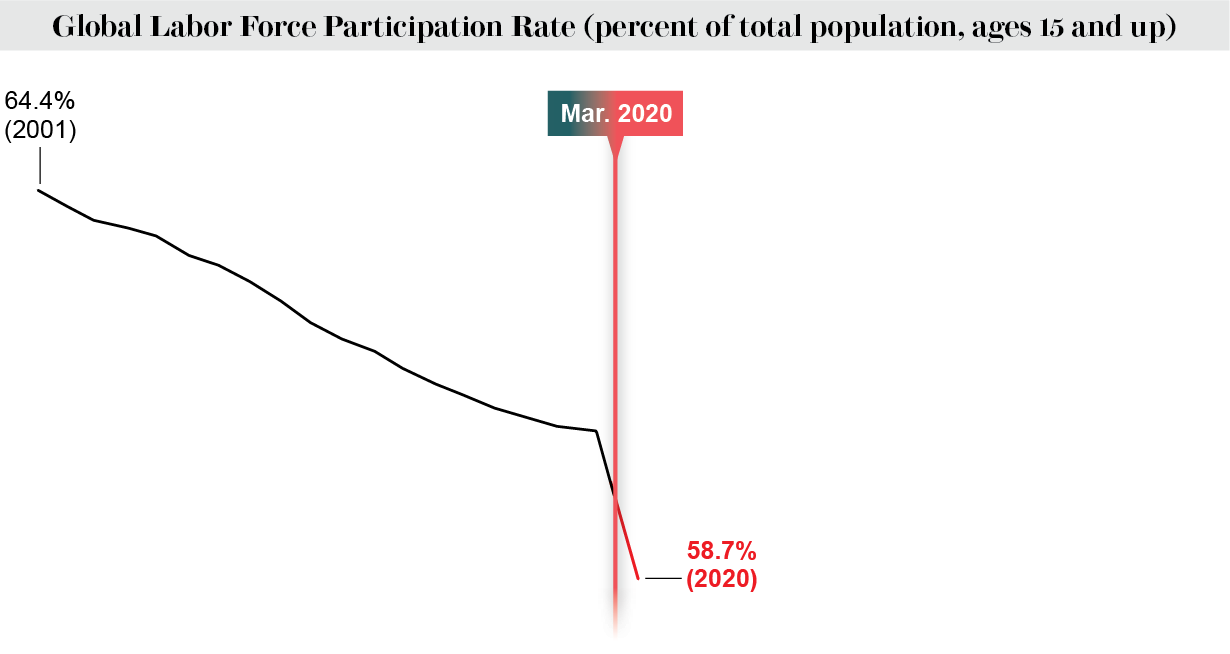
Labor Force Participation
The worldwide share of people in the labor force—defined by the World Bank as those aged 15 or older who supply labor for the production of goods and services—has been gradually falling in recent decades (although trends have varied by country). Since 1990 the typical annual fluctuations were around 0.1 percent. From 2019 to 2020 the global rate fell from around 61 percent of the population to less than 59— a sudden, steep drop.
The burden of job loss is not shared evenly. In mid-2021 the International Labor Organization reported that although men’s global employment had returned to prepandemic levels, there were still 13 million fewer women in the work force than in 2019. People in low-paying jobs were also affected disproportionately, in part because their roles may not be compatible with remote work. The U.S.-based Brookings Institution reported that “before COVID-19, nearly half of all working women . . . worked in jobs paying low wages, with median earnings of only $10.93 per hour.” Hispanic and Latina women represent an outsize share of these workers, compared with white women.
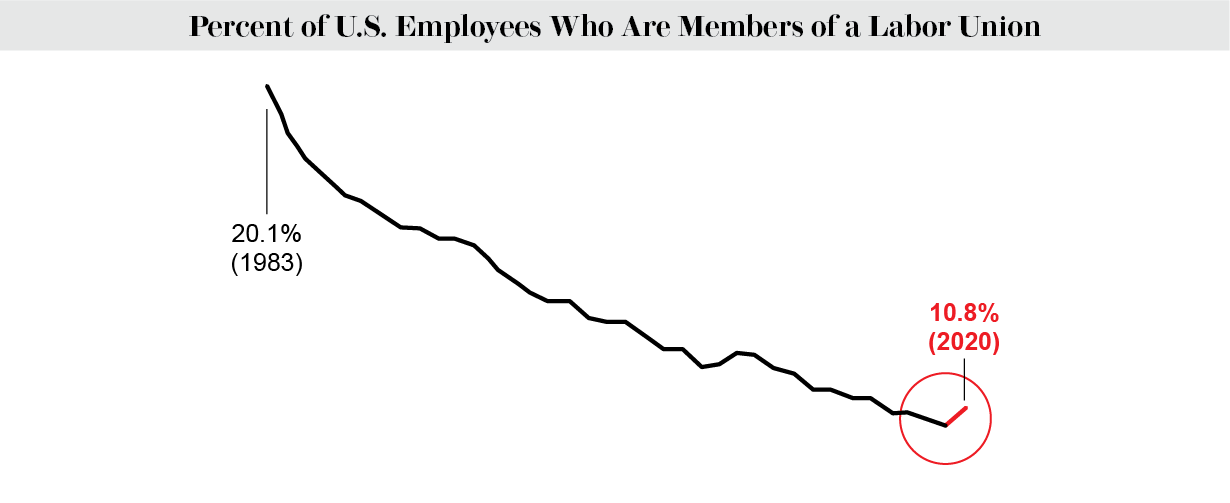
Unions are on the rise. People who were put in the category of “essential worker” in 2020 found that their roles had become both newly dangerous and indispensable. Yet many did not feel their employers responded adequately to keep them safe and fairly compensated. Perhaps in response to these developments, the U.S. has seen a recent uptick in unionized workers as a percent of its total workforce.
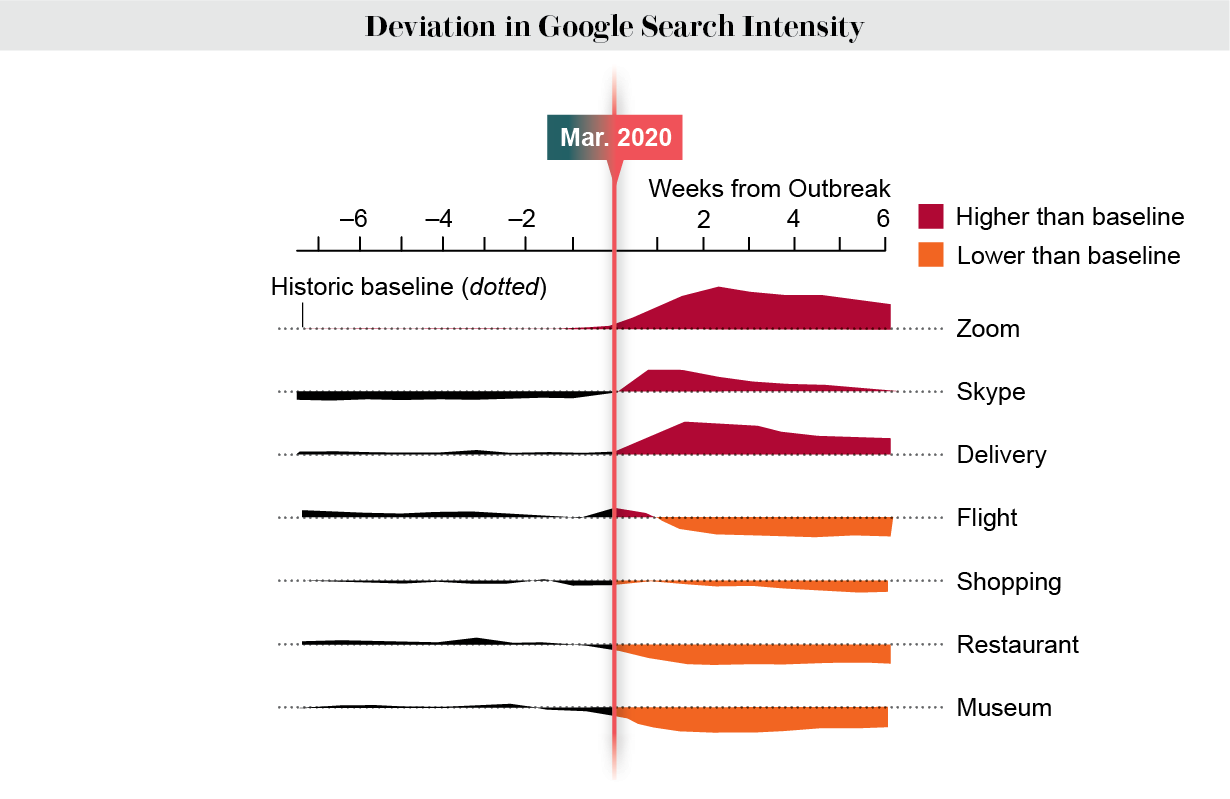
Industry Ups and Downs
A look at worldwide trends of Google search terms reveals clear industry winners and losers. When lockdowns put an abrupt stop to nonessential travel, searches including words like “hotel” and “airport” became scarce. Meanwhile remote workers sent “Zoom” sky rocketing, and people avoiding the grocery store performed abundant searches for “delivery.”
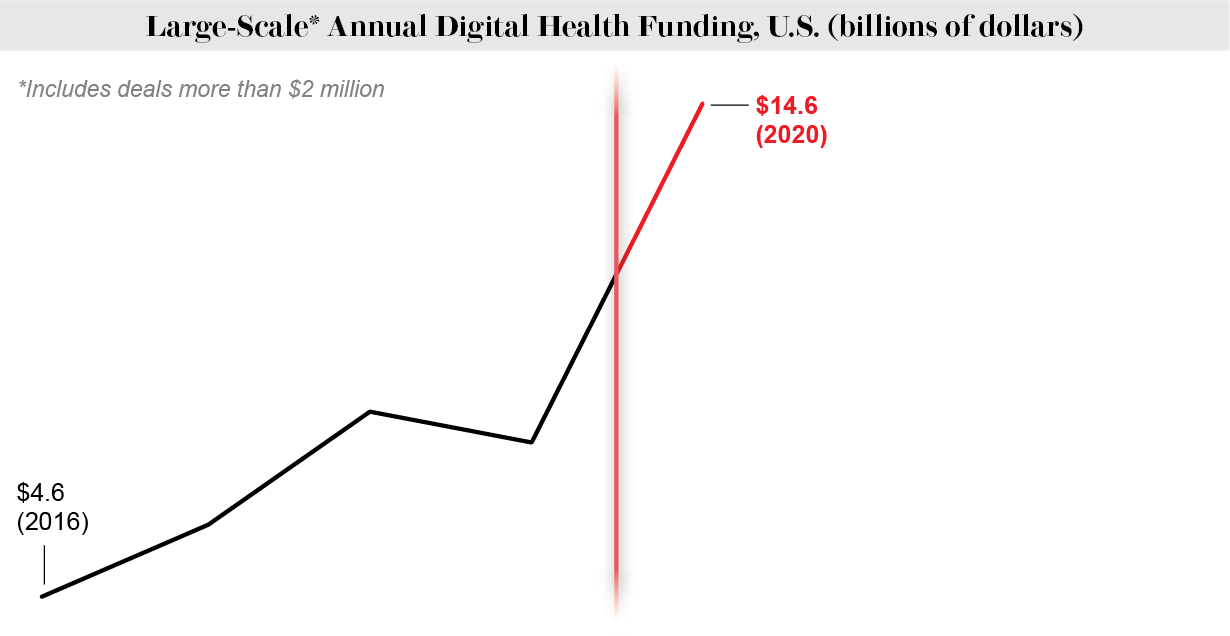
Telehealth Investments
Telehealth uses certain technologies to provide health care at a distance. Examples range from sensors that allow for remote tracking of vital signs to consultations with a medical professional by phone or computer. It is not a new concept, but global investments—in terms of number of investors and scale of contributions—jumped up in 2020 and continued to break records in 2021. The chart here shows one measure: cumulative investments in digital health companies.
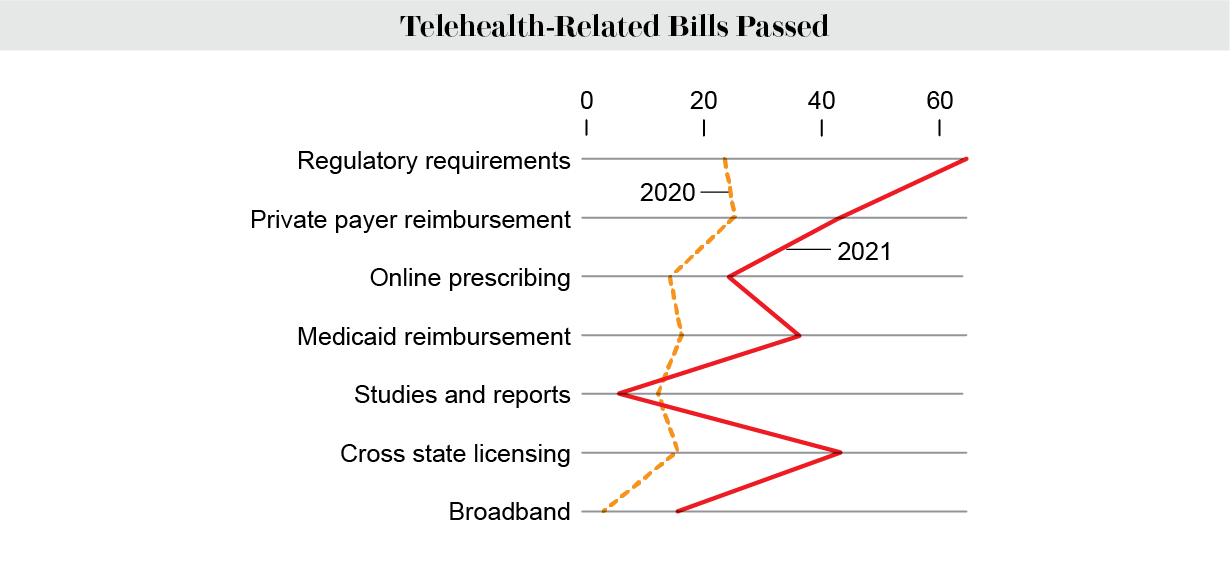
Telehealth Policy
In the U.S., federal and state laws control the type and extent of telehealth services available to patients. During the COVID public health emergency, regulations shifted quickly, making the option of remote care more accessible to more people. Advocates are pushing for continued— and expanded—access, even as the acute need wanes.
EDUCATION
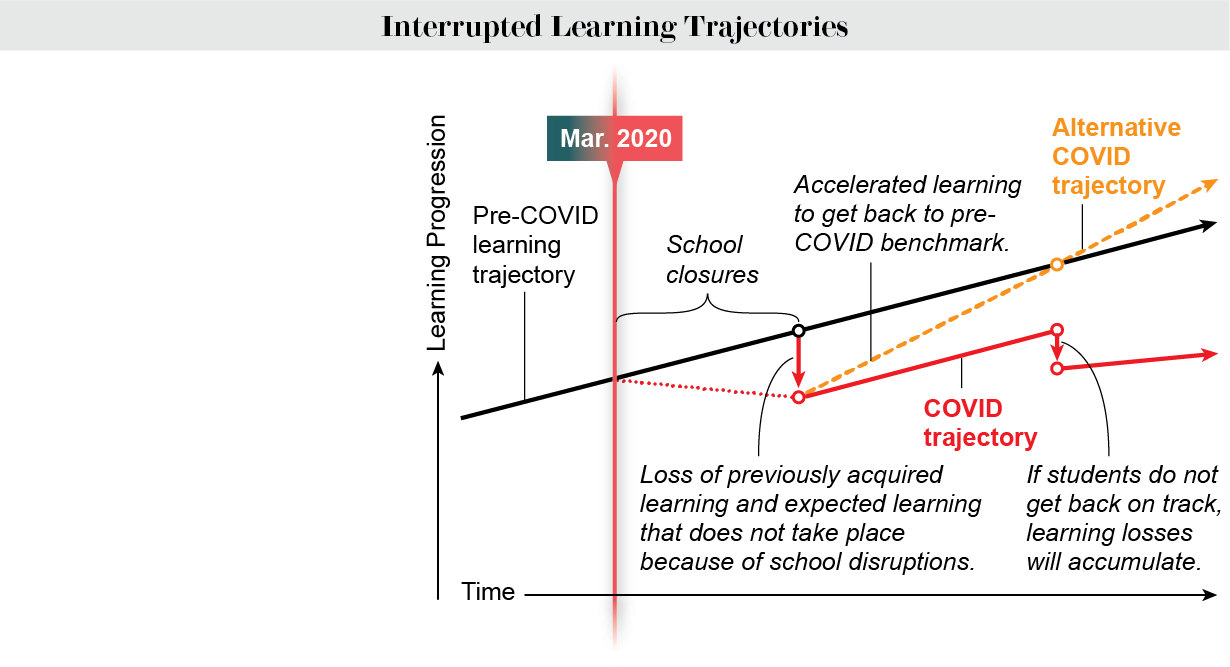
A report from the World Bank, UNESCO and UNICEF warns that COVID-related disruptions caused “the worst education crisis on record.” Children in low- and middle-income countries have suffered the biggest losses because of school closures and will likely experience longer-lasting effects than those in high-income nations. “Affected cohorts of children end up with lower educational attainment, as well as lower earnings and higher unemployment in adulthood.”
Disrupted Learning Trajectories
According to the World Bank, some evidence shows that a portion of the long-term losses “are attributable to slower learning once children return to school.” If educators and administrators are given the resources and support to respond to pandemic-related setbacks with an “accelerated learning trajectory,” students may still catch up. But that would require immediate, sweeping changes to education systems, including consolidating the curriculum, increasing instructional time and tutoring students in small groups.
TRUST
The success of any democracy depends largely on the degree to which the public trusts its institutions to act in its best interest. In many countries, political responses to COVID appear to have shifted public perceptions of corruption in government—some for better, others for worse.
Perceived Corruption (Global)
According to the organization Transparency International, the corrosive effects of corruption are amplified during emergencies, which can in turn exacerbate the emergency. Some of the key factors in this spiral of harm are diversion of funds from essential services, opaque government spending, and breaches of human rights in the management of the crisis. All these issues arose during the pandemic, and people all over the world suffered and died as a result.
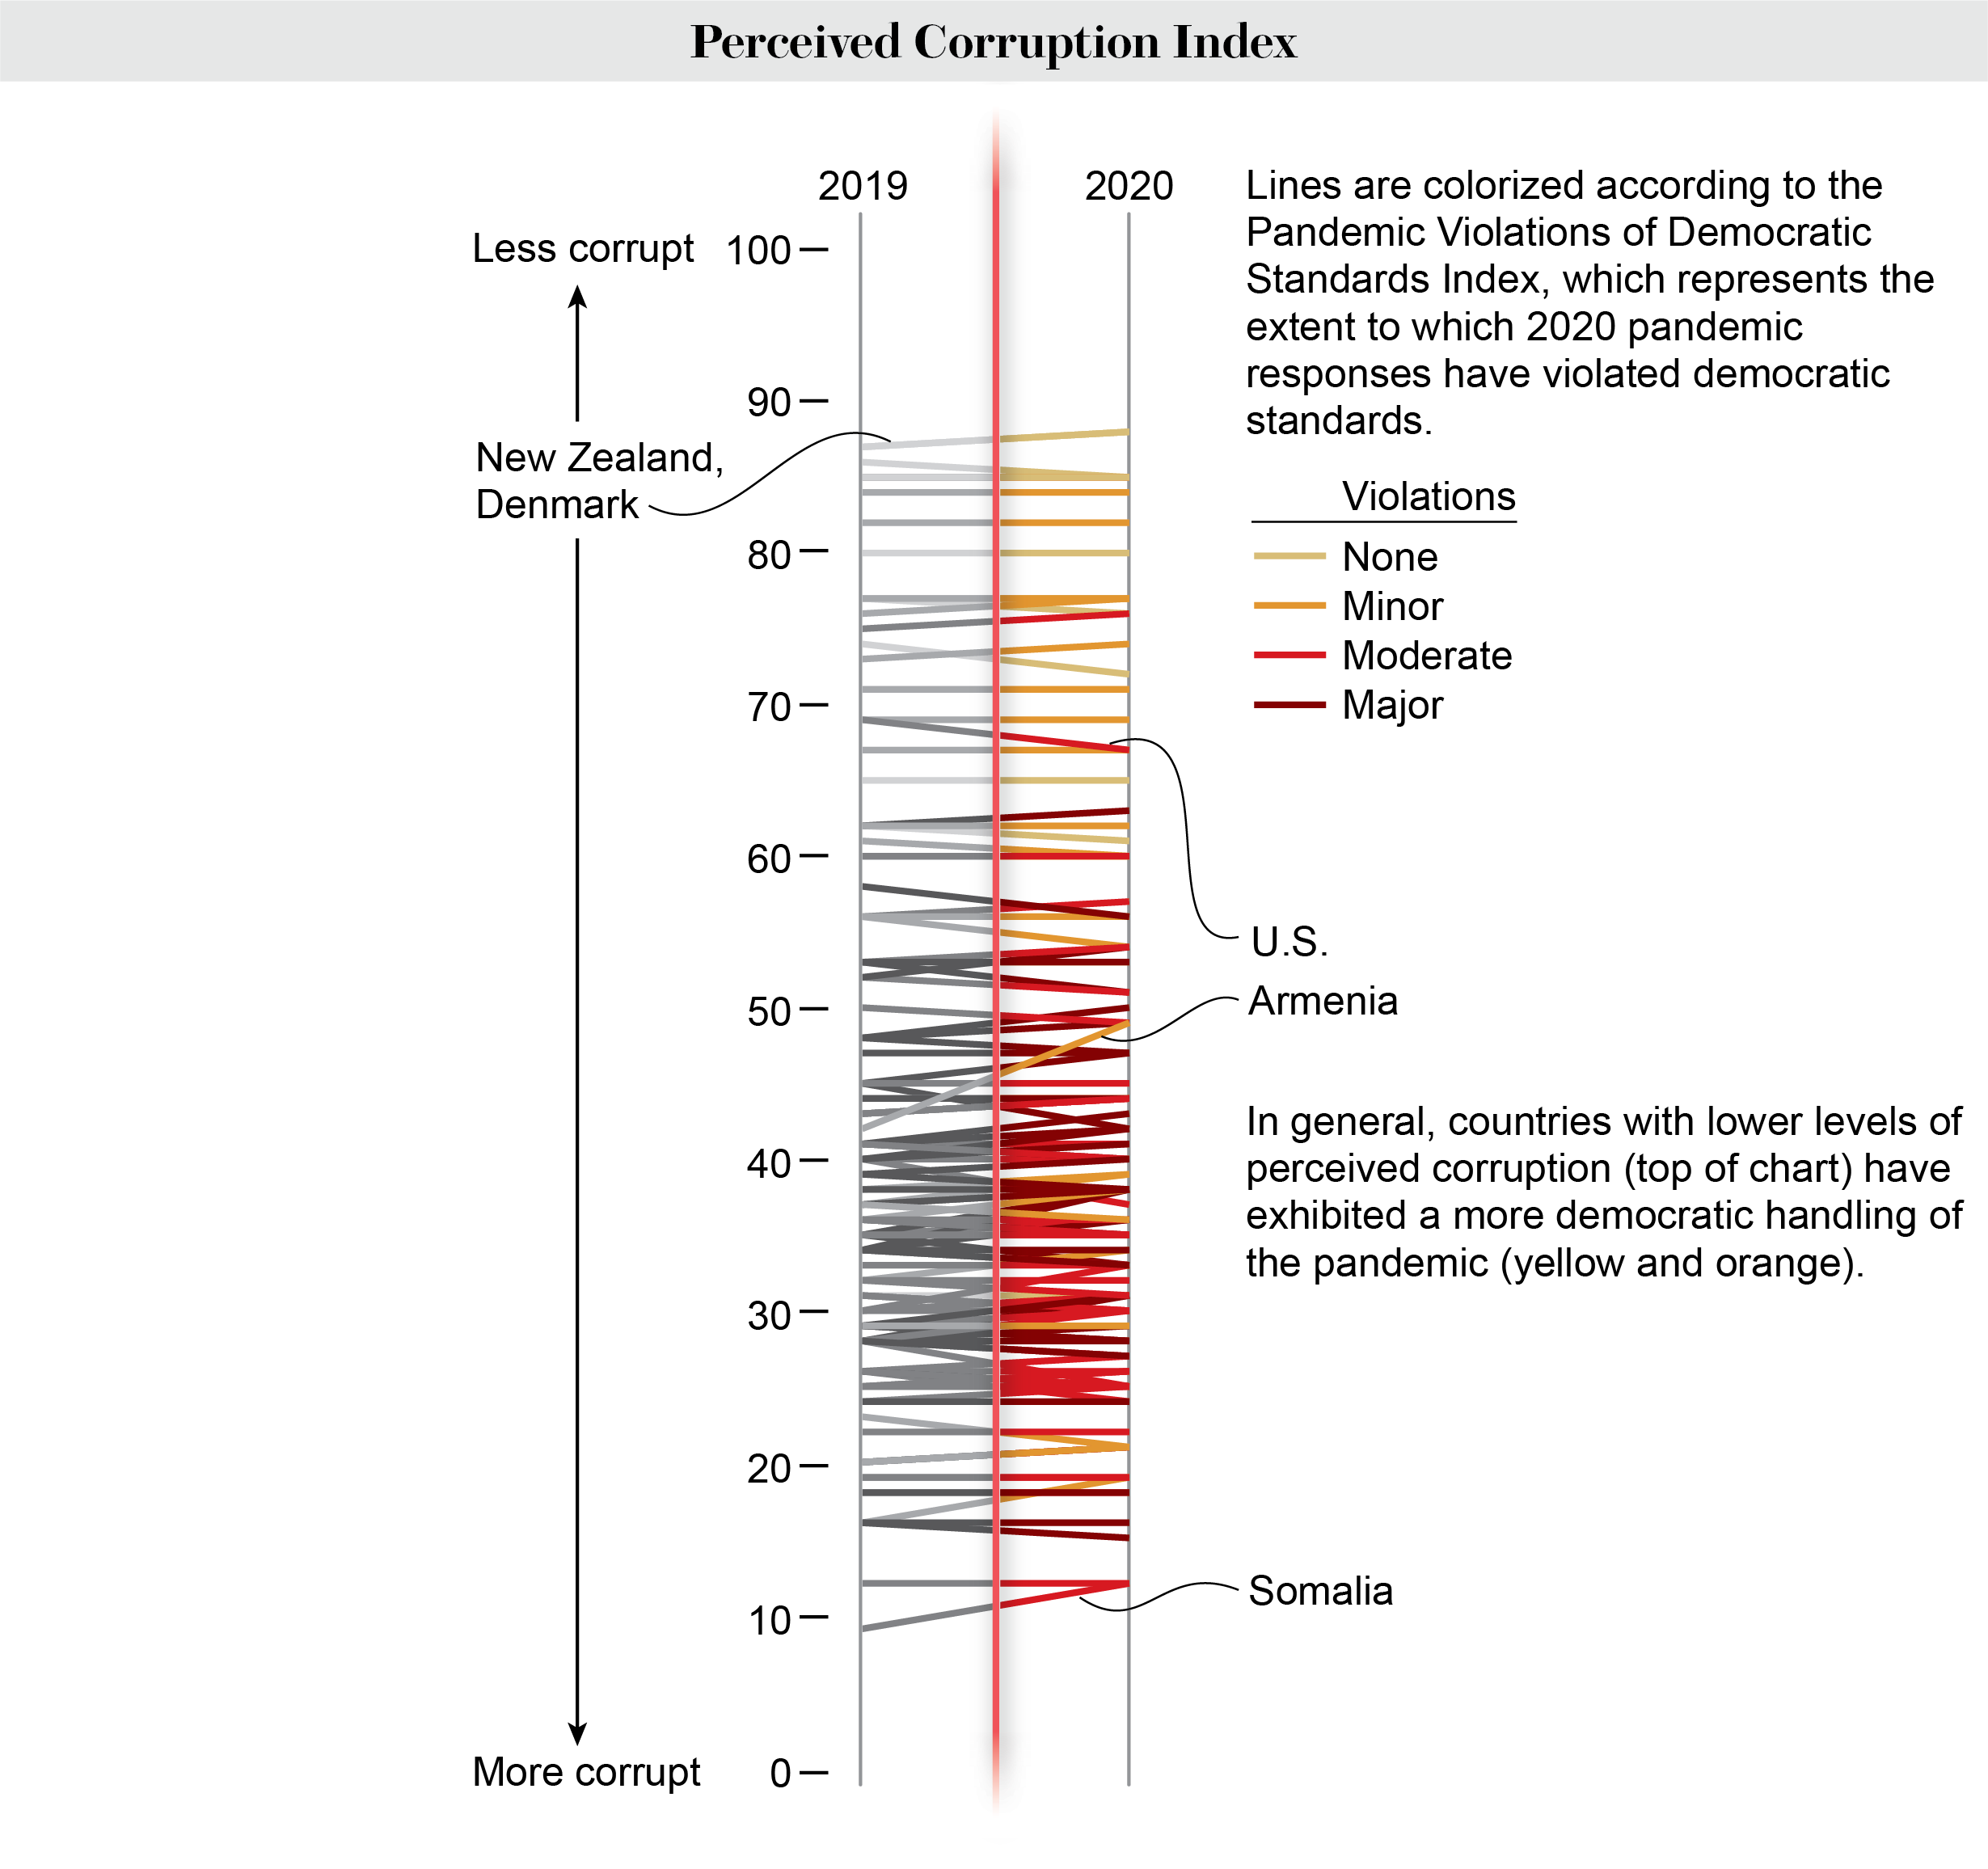
Successes and failures
In New Zealand, which famously handled COVID quite well, levels of public trust started out high in 2019 and improved in 2020 as the government maintained democratic standards throughout its response. In the U.S., however, violations of democratic standards seem to have worsened perceptions of corruption at the same time the country has suffered devastating losses during the pandemic.
New rules require interpersonal trust.
“The problem is that for the recommendations or regulations to work, we need to trust our fellow citizens as well as the government institutions that are issuing them. If people do not believe that most others are going to play by these novel and restrictive rules, they are unlikely to adhere to them themselves.” —Political scientist Bo Rothstein, in Scientific American, March 2020
MOVING FORWARD
The story of COVID and its myriad impacts is far from over. As we enter year three of the pandemic, data will continue to play a key role in quantifying the waves of change that ripple through society. Some of these data will help us make personal risk assessments in our daily lives, whereas others might inform policy decisions. Charts and graphics can also highlight emerging trends that might otherwise get lost as we navigate the daily noise of an ongoing crisis.